Returns

us.jpg   fr.jpg

Bloomberg U.S. Aggregate Return Distribution when starting yields are between 4-5%

Chart 7 24 pm.png

Higher returns have historically followed higher starting yields (%) (1976-2024)

Chart 7 24 am.png

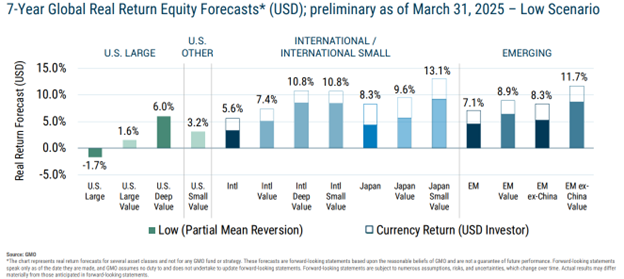
The Case for Investing in International Markets (%) (2013-2024)

Chart 7 23 pm.png

Investors need to manage equity sell-offs, regardless of their origin (%)

Chart 7 23 am.png

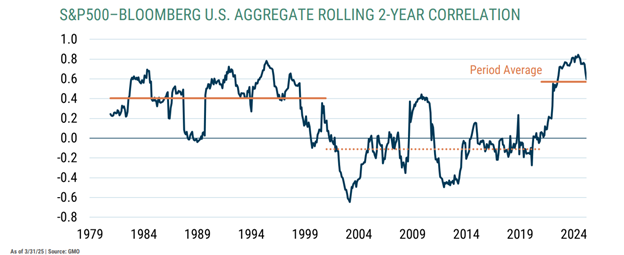
When stocks decline, Treasuries have provided attractive returns (%) (1929-2022)

Chart 7 22 pm.png

High quality core bonds may be able to deliver more attractive returns than equities (5-year annualized return)

Chart 7 22 am.png

S&P 500 Index Historical Risk & Return (1926-2024) Annualized Total Returns

Chart 7 21 pm.png

S&P 500 total returns since World War II

200.png

$100k invested in 6-month CDs against inflation (1990-2025)

199.png

Private Equity vs. Public Market Performance

198.png

Syndicate content